¶ The Interface
¶ Basics
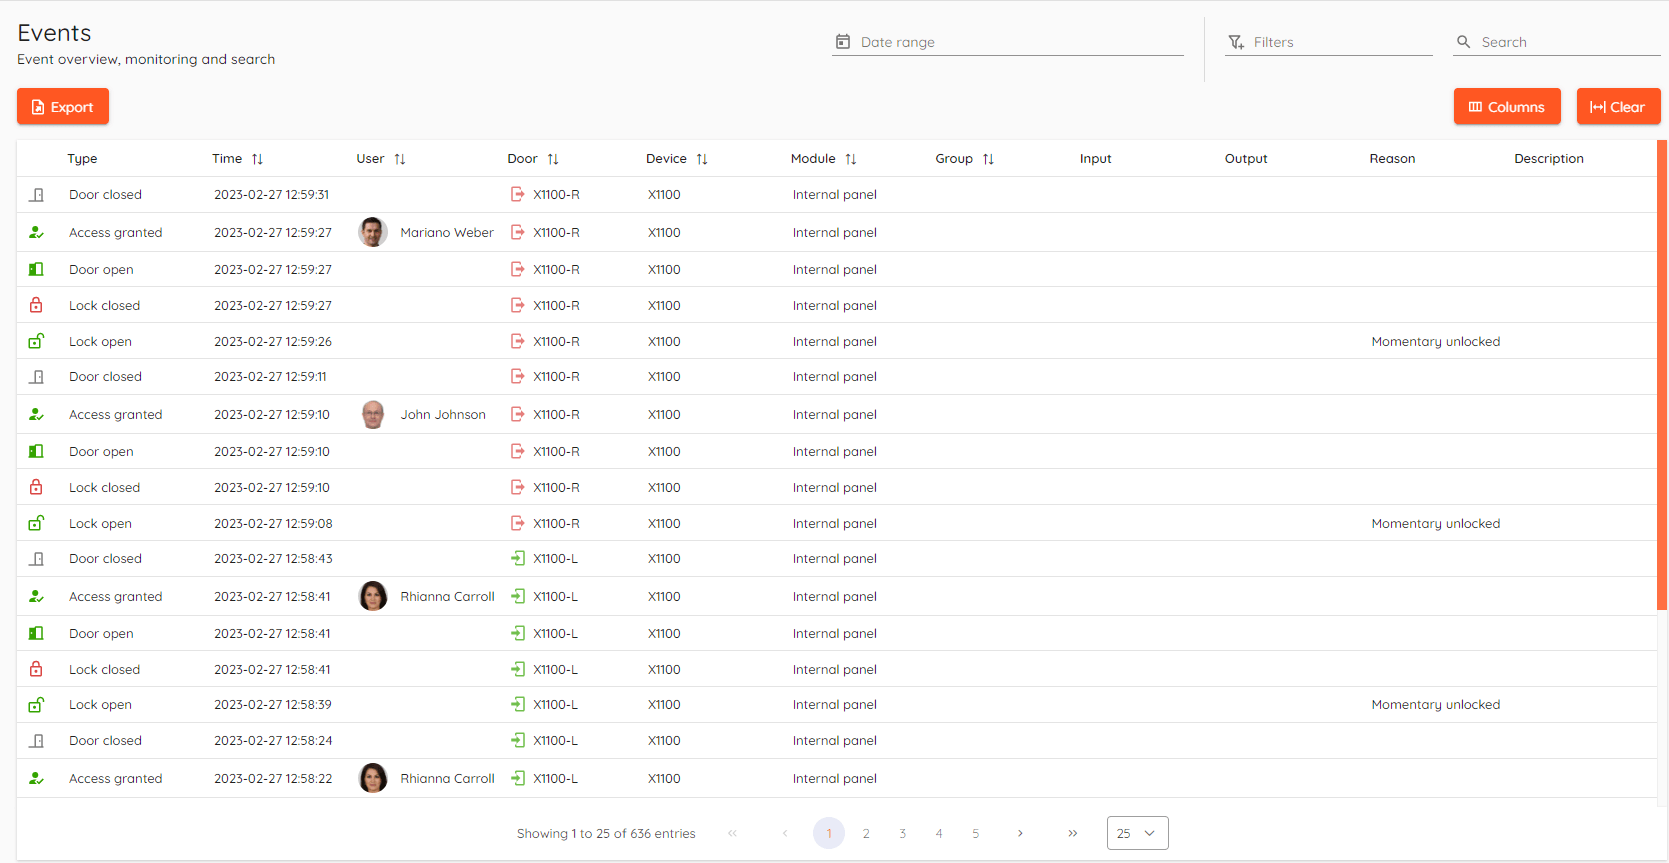
All events that are visible are coming directly from devices, there are only few artificial events created by CredoID.
¶ View
Columns button in the right top corner allows you to configure what columns you want to see. Every column is visible by default. You can sort, re-order or resize columns of the table to your own liking.
Clear button will reset your customization and set view to default.

In the middle bottom you can see total count of events in your system. You can choose how many events you see per page either it's 25, 50 or 100.

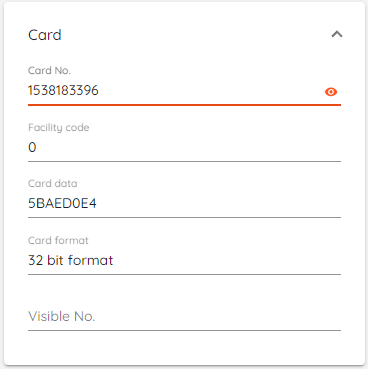
By clicking on any access event you will see details pop-up from the right side. It will contain additional information such as card details.

Card details is hidden by default, clicking  button will make details visible.
¶ Filters and search
Top right corner contains three fields called Date range, Filters and Search.

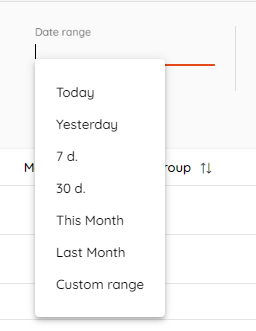
Date range allows to narrow down view to selected timespan. It can be one of the built-in values or you can set "custom" range.
Filters allow you to create your own custom view where you can select what you want to see exactly.
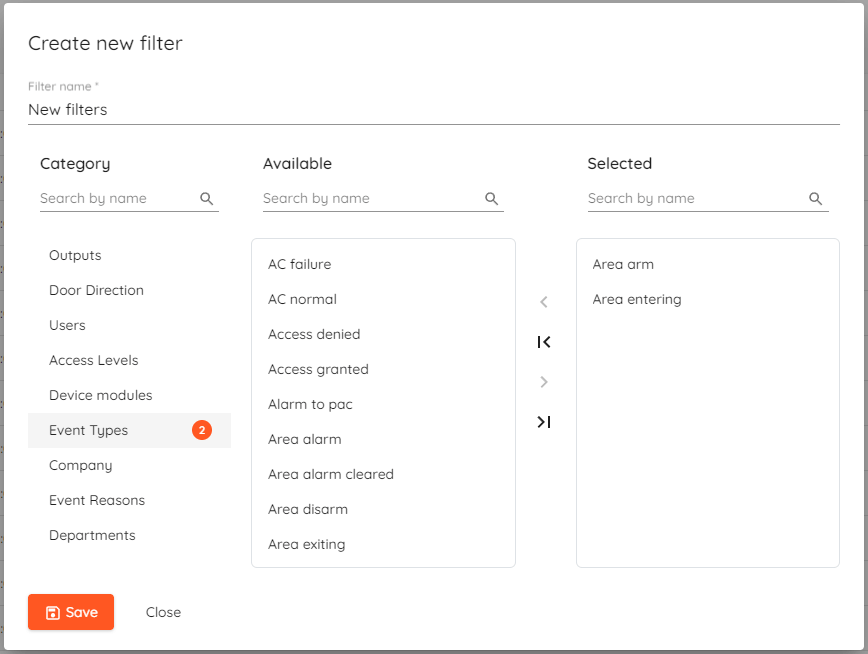
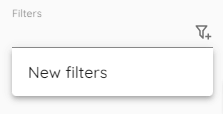
You can create as many filters as you like and then apply them by clicking on the Filters field and selecting the one you need.
In the Search field you can quickly filter events by typing string and it will show everything that contains it.
¶ Export
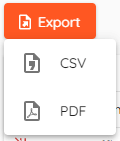
You can export current view to a CSV or PDF file. To do that you have to select Date range and click on Export where you have to choose file format.
In CSV you will see all of the available columns, but PDF has pre-formatted layout which is not customisable at the moment.
