¶ The Interface
¶ Main dashboard
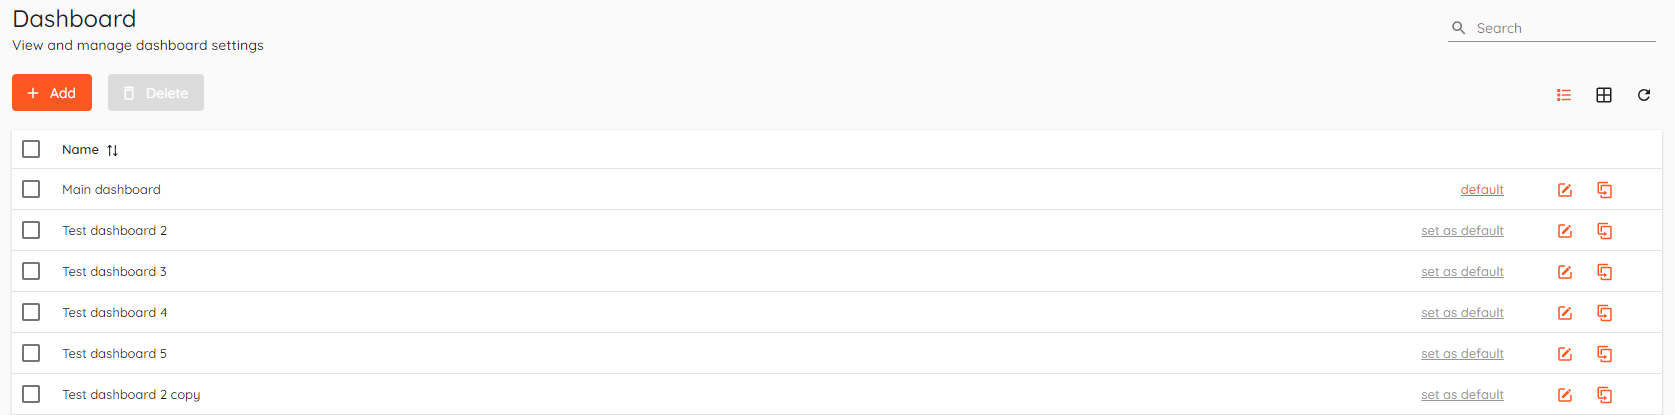
¶ Dashboard list
¶ Table view
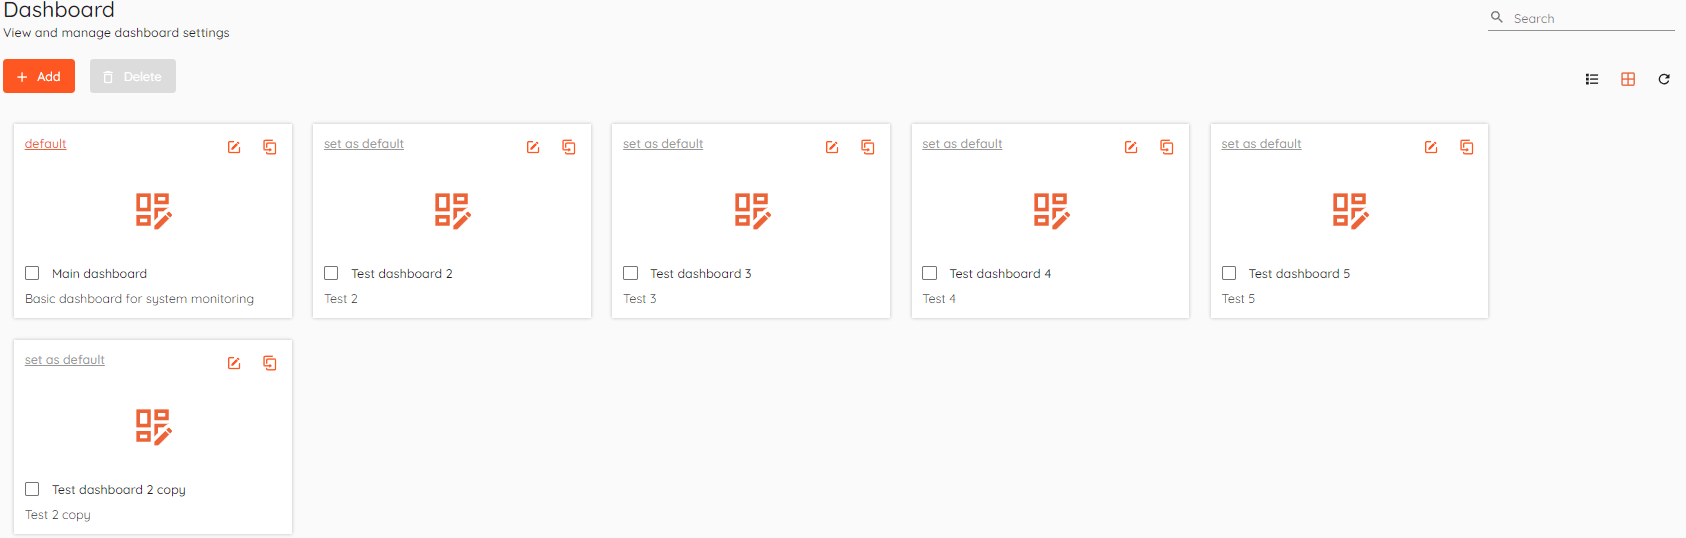
¶ Grid view
¶ Basics
Charts provide a visual, intuitive way to analyze access control data, improving security management by making it easier to spot trends, monitor usage, and detect potential security breaches.
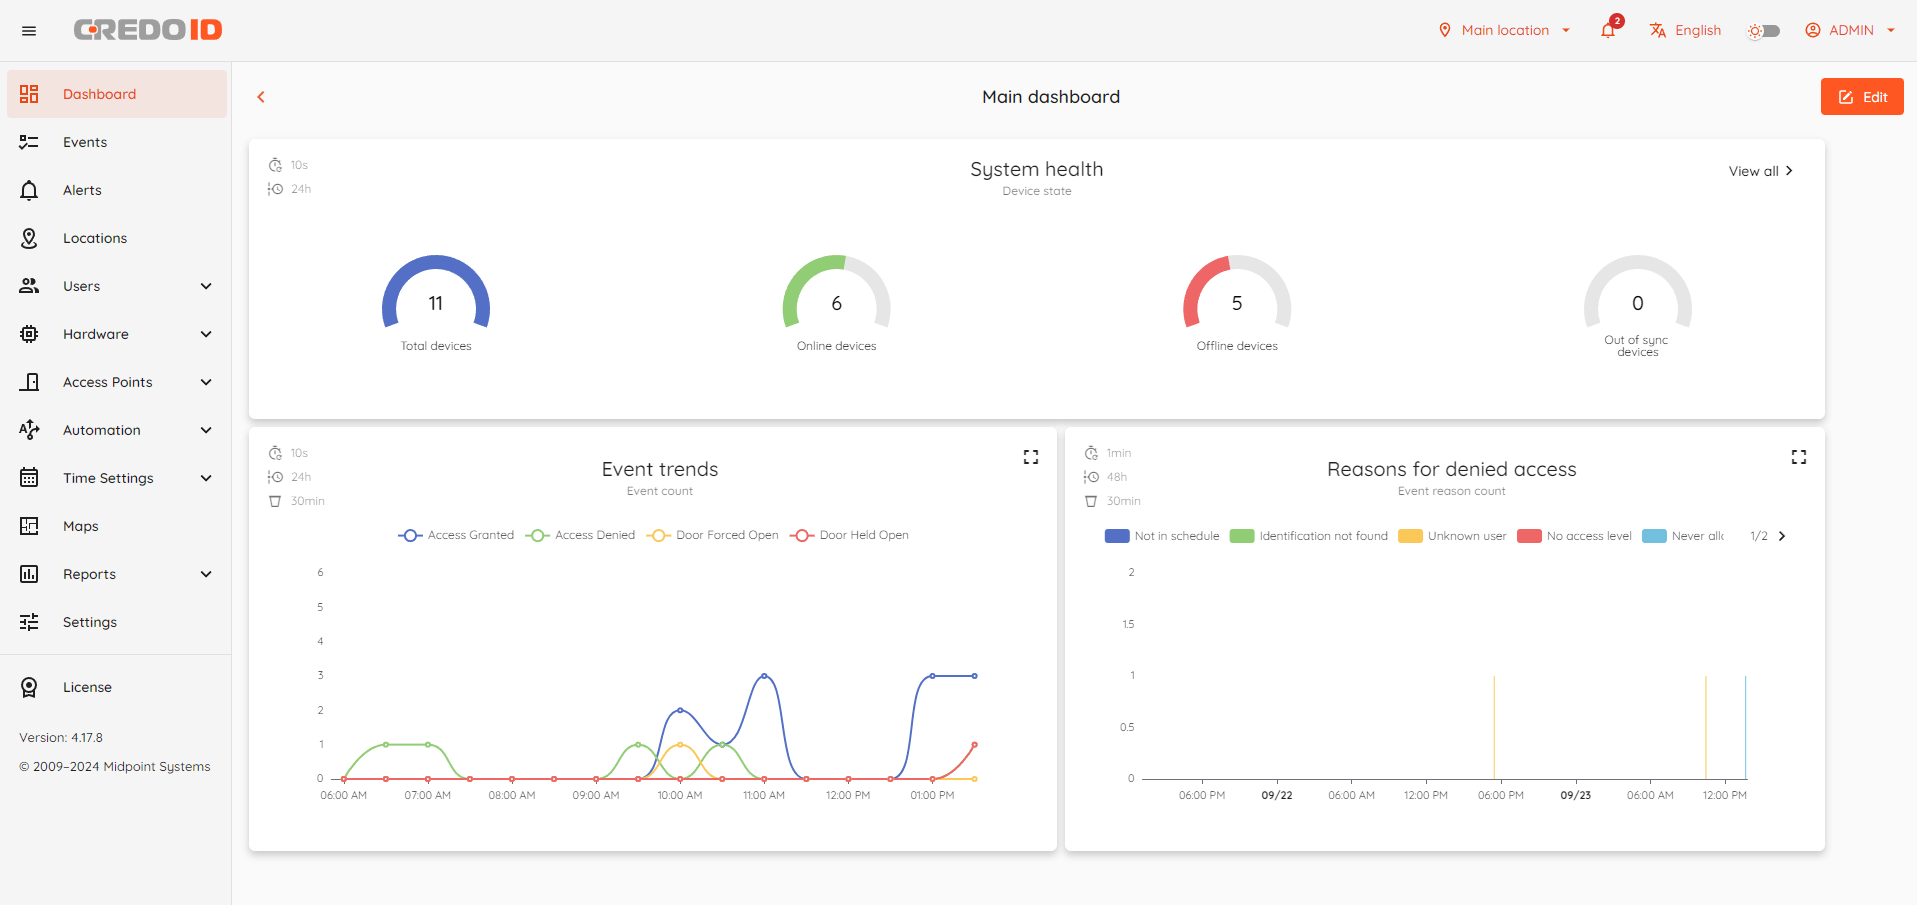
¶ Main dashboard
The main dashboard is preconfigured and set as the default. It will always open first if accessible by the operator, otherwise, the dashboard list will appear.
Main dashboard has 3 charts:
- Device state chart - device state monitoring.
- Event count chart - event monitoring by selected event types.
- Event reason count chart - event monitoring by selected event reasons.
¶ Creating a new dashboard
To create a new dashboard first you have navigate to dashboard list.
When visiting dashboard page - default dashboard is opened, to nagivate to dashboard list - click "![]() " button wihch is located in the top left corner of the dashboard.
" button wihch is located in the top left corner of the dashboard.
While in dashboard list - click "Add" button

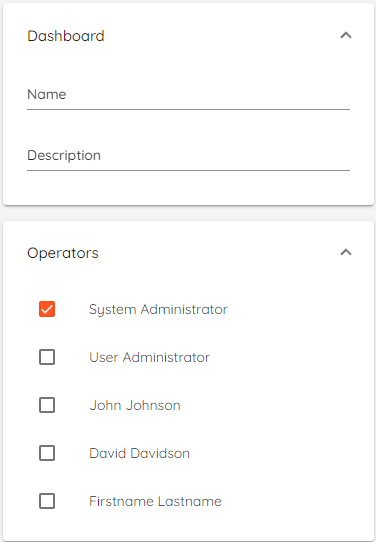
Enter name for your dashboard and select which operators will have access to it. (They also need to have "Dashboard read" permission).
Adding description is optional.
Click "Save", close the side menu and click on created chart - empty dashboard without charts will open.
¶ Adding a chart
To add a chart - open any dashboard and click "Edit" button (upper right corner).
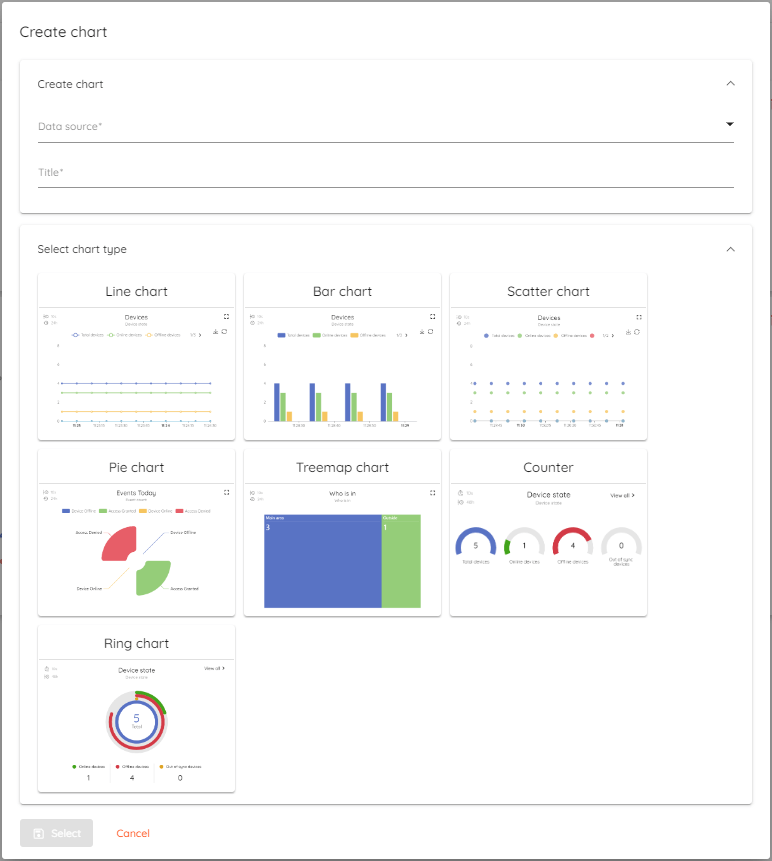
In "Edit" mode click "Add" button (upper left corner) - "Create chart" window will open.
When a chart is added to the dashboard, it can be resized and moved around within the workspace area.
¶ Data sources
- Device state - Device state statistics.
- Occupancy - Occupancy of the selected areas based on access events.
- Event count - Provides the count of events in the system based on filter.
- Event reason count - Provides the count of event reasons in the syste based on filter.
- Door usage - Door usage statistics.
- Alert priorities - Alert priority event counts.
¶ Chart type availability for each data source
- Device state - All charts.
- Occupancy - Pie chart, Treemap chart.
- Event count - Line chart, Bar chart, Scatter chart.
- Event reason count - Line chart, Bar chart, Scatter chart.
- Door usage - Pie chart, Treemap chart.
- Alert priorities - Pie chart, Treemap chart, Counter, Ring Chart.
¶ Event count chart create example
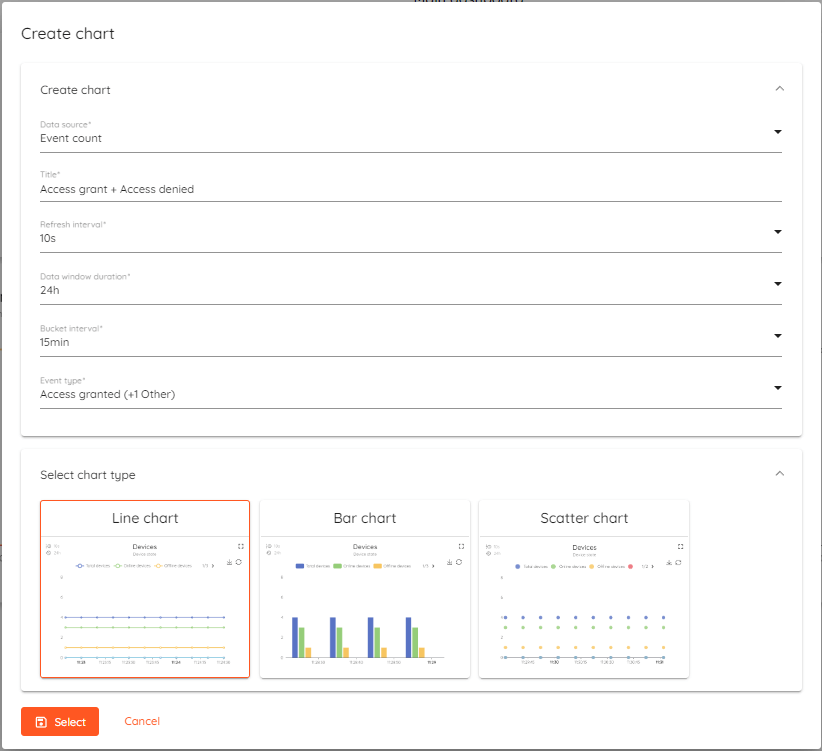
This chart will display the event counts for "Access Granted" and "Access Denied" events, refreshing every 10 seconds. It will show data from the last 24 hours, with each data point representing a 15-minute interval.
¶ Editing a chart
While in "Edit" mode - click on any chart and menu with chart properties will open.
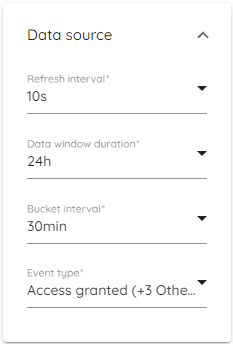
- Refresh interval - Set how often the chart will be refreshed.
- Data window duration - Time range that the chart displays data for at any given moment.
- Bucket interval - Set how much time will each data point represent.
- Event type - Add or remove which event types will be shown in a chart.
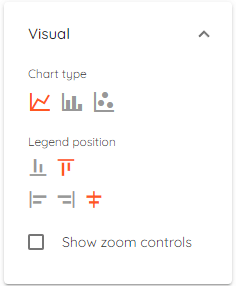
- Chart type - Change between available chart types.
- Legend position - Change legend position and alignment.
- Show zoom controls - If enabled - additional scrollbar appears at the bottom of the chart letting you control zoom level without using the mouse wheel.
Zooming in/out is always allowed using the mouse wheel when hovering over the chart, except when in "Edit" mode.
Charts with different data sources will have different options available.